-
Locations of sable antelope sites, Kenya
This data was used in Map 6.4 and Map 6.5 in Nature's Benefits in Kenya: An Atlas of Ecosystems and Human Well-Being. Original data and report are downloadable at http://www.unep.org/eafatlas/dbke.htm.
-
Average water consumption of livestock and wildlife by sub-basin in Kenya, 19...
WRI/ILRI calculation based on animal data from DRSRS 2003; Grunblatt et al. 1995, 1996; and daily water requirements for selected species from MoWD and JICA 1992, Peden at al. 2003, 2004. This data was used in Map 3.13 in Nature's Benefits in Kenya: An Atlas of Ecosystems and Human Well-Being.
-
Grevy's zebra population in Kenya, 1994-96
This data was used in Map 5.14 in Nature's Benefits in Kenya: An Atlas of Ecosystems and Human Well-Being. Census counts of observed numbers of Grevy's Zebra during low-altitude flights, aggregated to 5km grid cells. Please refer to DRSRS for updates.
-
Grevy's Zebra Population in Kenya, 1977-78
This data was used in Map 5.13 in Nature's Benefits in Kenya: An Atlas of Ecosystems and Human Well-Being. Census counts of observed numbers of Grevy's Zebra during low-altitude flights, aggregated to 5km grid cells. Please refer to DRSRS for updates.
-
Bleaching observations (1963-2010)
This dataset was used as base data in Reefs at Risk. Point locations of reported observations of coral bleaching between 1963 and 2010. This dataset was built upon an original bleaching database developed at UNEP-WCMC, and has been maintained and updated regularly by ReefBase since early 2002.
-
Dugong Sites and Dolphin Schools on the Eastern Coast of Kenya
This data was used in Map 6.4 and Map 6.5 in Nature's Benefits in Kenya: An Atlas of Ecosystems and Human Well-Being. Original report and data available on http://www.unep.org/eafatlas/dbke.htm
-
Milk Production Per Square Kilometer in Kenya, 1997
This data was used in Map 4.5 in Nature's Benefits in Kenya: An Atlas of Ecosystems and Human Well-Being.
-
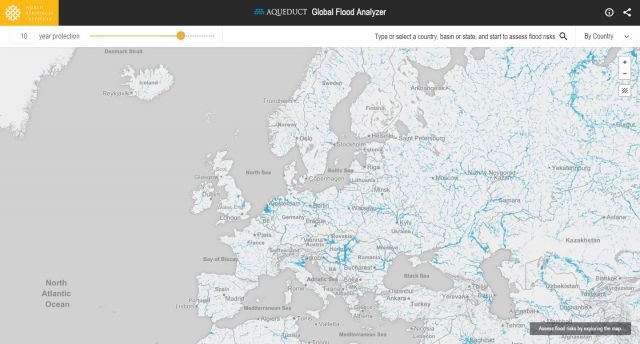
Featured Aqueduct Global Flood Risk Maps
For the current scenario, we used hydrological data from 1960 through 1999 for generating flood inundations for 9 return periods, from 2-year flood to 1000-year flood, and 2010 GDP, population, and land use data for assessing flood impacts. For future projections, we used 5 GCMs (Global Climate...
-
Annual Growth of Biomass and Theoretically Harvestable Biomass Yield outside ...
This data was used in Map 7.6 and Map 7.7 in Nature's Benefits in Kenya: An Atlas of Ecosystems and Human Well-Being. Values of zero for both fields pertain to croplands and urban areas, and should be displayed as ""not applicable."" Note: All areas classified as 'natural and semi-natural' in...
-
Milk Surplus and Deficit in Central and Western Kenya in 1997
Calculations of milk production were done by assessing the number of dairy cattle in an administrative area, and extrapolating out liters of milk per area. Demand for milk was calculated by estimating the milk needs per person, and applying that number to the population density of each area....
-
Uganda Safe Water Coverage
Rural safe water coverage as defined by the Directorate of Water Development, Ministry of Water and Environment, Uganda. Data used in maps 3, 4, 5, 6 of ""Mapping a Healthier Future: How Spatial Analysis Can Guide Pro-Poor Water and Sanitation Planning in Uganda."" from Health Planning...
-
Global Map of Threat of Blast or Poison Fishing
This dataset was used as base data in Reefs at Risk. Map of blast and poison fishing (1 km grid) was developed for use in the Reefs at Risk Revisited project as a component of the model of overfishing and destructive fishing pressure on coral reefs. This layer designates threat of blast and...
-
Theoretical Revenue from Papyrus Harvest
The dataset results from WRI's calculation based on 1. NATIONAL FOREST AUTHORITY (NFA). 1996. Land Cover GIS Database. Kampala, Uganda: Government of Uganda. 2. KARANJA, F., L. EMERTON, J. MAFUMBO, AND W. KAKURU. 2001. Assessment of the Economic Value of Pallisa District Wetlands. Kampala,...
-
Basins and sub-basins in Kenya
Calculations done by the World Resources Institute. This data was used in selected maps in Nature's Benefits in Kenya: An Atlas of Ecosystems and Human Well-Being.
-
Uganda Wetlands Extent and Types 1996
Data used in map 2 of "Mapping a Better Future: How Spatial Analysis Can Benefit Wetlands and Reduce Poverty in Uganda." from Wetlands Management Department, Ministry of Water and Environment, Uganda; Uganda Bureau of Statistics; International Livestock Research Institute; and World Resources...
-
Aqueduct Global Maps 2.0
Companies can use this information to prioritize actions, investors to leverage financial interest to improve water management, and governments to engage with the private sector to seek solutions for more equitable and sustainable water governance. Aqueduct Global Maps 2.0 includes indicators of...
-
Annual Projected Water Balance by Subdrainage Area in Kenya, 2000 and 2010
Calculations done by the World Resources Institute. This data was used in Map 3.7 in Nature's Benefits in Kenya: An Atlas of Ecosystems and Human Well-Being.
-
Number of beds by hotel on the eastern coast of Kenya
Number of beds calculated by ILRI and WRI, based on RoK 2003 and UNEP 1998. This data was used in Map 6.4 and Map 6.5 in Nature's Benefits in Kenya: An Atlas of Ecosystems and Human Well-Being.
-
Featured Aqueduct Global Maps 2.1 Data
Awareness around the physical, regulatory, and reputational water risks to companies and their investors is on the rise and robust, comparable and comprehensive data is needed to help assess these water-related risks. In response to this demand, the World Resources Institute developed the...
-
Reefs at Risk Revisited (Social Vulnerability Data)
This shapefile features the Exclusive Economic Zones (EEZs) for 108 coral reef countries and territories classified according to an index of their reef dependence, adaptive capacity, and social vulnerability. Results are presented as quartiles, with 27 countries/territories classified in each of...
