-
Milk Surplus and Deficit in Central and Western Kenya in 1997
Calculations of milk production were done by assessing the number of dairy cattle in an administrative area, and extrapolating out liters of milk per area. Demand for milk was calculated by estimating the milk needs per person, and applying that number to the population density of each area....
-
Supplementary Materials for "State of the Nationally Determined Contributions...
This dataset presents information on the adaptation components of 86 countries’ NDCs submitted until June 30, 2021, in association with the working paper State of the Nationally Determined Contributions: Enhancing Adaptation Ambition. Nine NAPs submitted by the 86 countries during this time frame...
-
Uganda Safe Water Coverage
Rural safe water coverage as defined by the Directorate of Water Development, Ministry of Water and Environment, Uganda. Data used in maps 3, 4, 5, 6 of ""Mapping a Healthier Future: How Spatial Analysis Can Guide Pro-Poor Water and Sanitation Planning in Uganda."" from Health Planning...
-
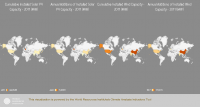
CAIT - Country Clean Technology Data
This collection emerges from a collaboration of five leading research institutions: World Resources Institute (WRI), Institute for Global Environmental Strategies (IGES), Öko Institut, Renmin University, and The Energy and Resources Institute (TERI), based in the target countries. Researchers at...
-
Featured Global Power Plant Database
The Global Power Plant Database is a comprehensive, open source database of power plants around the world. It centralizes power plant data to make it easier to navigate, compare and draw insights for one’s own analysis. The database covers approximately 35,000 power plants from 167 countries and...
-
China Overseas Finance Inventory Database
The COFI database includes power-generation projects in Belt and Road Initiative (BRI) countries financed by Chinese corporations and banks that reached financial closure from 2000 to 2023. Types of financing include debt and equity investment, with the latter including greenfield foreign direct...
-
Global Map of Threat of Blast or Poison Fishing
This dataset was used as base data in Reefs at Risk. Map of blast and poison fishing (1 km grid) was developed for use in the Reefs at Risk Revisited project as a component of the model of overfishing and destructive fishing pressure on coral reefs. This layer designates threat of blast and...
-
Theoretical Revenue from Papyrus Harvest
The dataset results from WRI's calculation based on 1. NATIONAL FOREST AUTHORITY (NFA). 1996. Land Cover GIS Database. Kampala, Uganda: Government of Uganda. 2. KARANJA, F., L. EMERTON, J. MAFUMBO, AND W. KAKURU. 2001. Assessment of the Economic Value of Pallisa District Wetlands. Kampala,...
-
Aqueduct Global Flood Risk Country Rankings
Key Findings Approximately, 21 million people worldwide could be affected by river floods on average each year, and the 15 countries with the most people exposed, including India, Bangladesh, China, Vietnam, Pakistan, Indonesia, Egypt, Myanmar, Afghanistan, Nigeria, Brazil, Thailand, Democratic...
-
Climate Watch - U.S. States Greenhouse Gas Emissions
Climate Watch Historical GHG Emissions module enables data analysis by allowing users to quickly narrow down by year, gas, state, and sector. Automatic calculations for percent changes from prior year, per capita, per GDP, and cumulative number across years are also available. Users are presented...
-
Basins and sub-basins in Kenya
Calculations done by the World Resources Institute. This data was used in selected maps in Nature's Benefits in Kenya: An Atlas of Ecosystems and Human Well-Being.
-
Uganda Wetlands Extent and Types 1996
Data used in map 2 of "Mapping a Better Future: How Spatial Analysis Can Benefit Wetlands and Reduce Poverty in Uganda." from Wetlands Management Department, Ministry of Water and Environment, Uganda; Uganda Bureau of Statistics; International Livestock Research Institute; and World Resources...
-
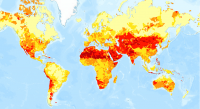
Aqueduct Global Maps 2.0
Companies can use this information to prioritize actions, investors to leverage financial interest to improve water management, and governments to engage with the private sector to seek solutions for more equitable and sustainable water governance. Aqueduct Global Maps 2.0 includes indicators of...
-
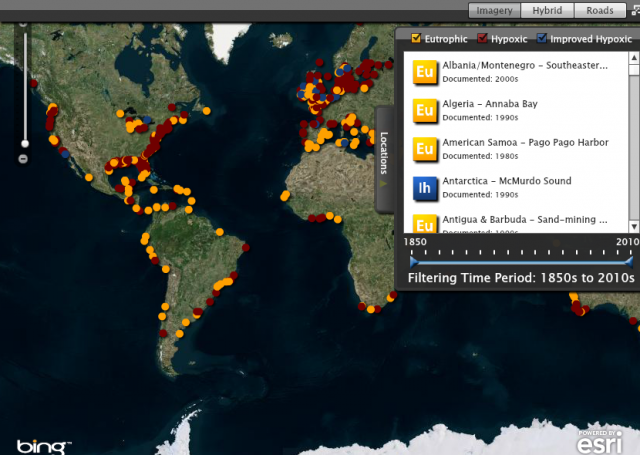
Eutrophication & Hypoxia Map Data Set
The Interactive Map of Eutrophication & Hypoxia represents 762 coastal areas impacted by eutrophication and/or hypoxia. There are 479 sites identified as experiencing hypoxia, 55 sites that once experienced hypoxia but are now improving, and 228 sites that experience other symptoms of...
-
Annual Projected Water Balance by Subdrainage Area in Kenya, 2000 and 2010
Calculations done by the World Resources Institute. This data was used in Map 3.7 in Nature's Benefits in Kenya: An Atlas of Ecosystems and Human Well-Being.
-
Number of beds by hotel on the eastern coast of Kenya
Number of beds calculated by ILRI and WRI, based on RoK 2003 and UNEP 1998. This data was used in Map 6.4 and Map 6.5 in Nature's Benefits in Kenya: An Atlas of Ecosystems and Human Well-Being.
-
Featured Aqueduct Global Maps 2.1 Data
Awareness around the physical, regulatory, and reputational water risks to companies and their investors is on the rise and robust, comparable and comprehensive data is needed to help assess these water-related risks. In response to this demand, the World Resources Institute developed the...
-
Reefs at Risk Revisited (Social Vulnerability Data)
This shapefile features the Exclusive Economic Zones (EEZs) for 108 coral reef countries and territories classified according to an index of their reef dependence, adaptive capacity, and social vulnerability. Results are presented as quartiles, with 27 countries/territories classified in each of...
-
Protected Areas in Kenya
This data was used in maps throughout Nature's Benefits in Kenya: An Atlas of Ecosystems and Human Well-Being.
-
Uganda Wetland Area Per Capita
The dataset results from WRI's calculation based on: 1. NATIONAL FOREST AUTHORITY (NFA). 1996. Land Cover GIS Database. Kampala, Uganda: Government of Uganda, NFA. 2. UGANDA BUREAU OF STATISTICS (UBOS). 2002b. 2002 Uganda Population and Housing Census GIS Database. Kampala, Uganda:...
