-
Percentage Food Crops in Central and Western Kenya
World Agroforestry Center (ICRAF) and Department of Resource Surveys and Remote Sensing (DRSRS), Ministry of Environment and Natural Resources. 2001. GIS Database of Land Use and Land Cover for Kenya's Medium to High Potential Districts. DRSRS interpretation of 5,747 aerial photographs from...
-
Indicators of Sustainable Agriculture: A Scoping Analysis
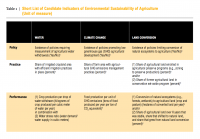
The spreadsheet “Evaluation of Candidate Indicators of Environmental Sustainability of Agriculture” presents the complete list of candidate indicators that were considered in the scoping analysis as well as the results of an assessment that determined the suitability of these candidate indicators...
-
NWIS 1997 Data (Uganda)
Some data were used in maps 4, 5, 6, 7, 8, 9, 10 of ""Mapping a Better Future: How Spatial Analysis Can Benefit Wetlands and Reduce Poverty in Uganda."" from Wetlands Management Department, Ministry of Water and Environment, Uganda; Uganda Bureau of Statistics; International Livestock Research...
-
Size of Agricultural Crops in Kenya
Used in Map 5.7 of Nature's Benefits in Kenya: An Atlas of Ecosystems and Human Well-Being. Original data are downloadable at www.africover.org.
-
Large-Scale Irrigation in Kenya
This data was used in Map 3.12 in Nature's Benefits in Kenya: An Atlas of Ecosystems and Human Well-Being. Original data are downloadable at www.africover.org.
-
Percent of Land under Cultivation in Kenya
Used in Map 5.4 of Nature's Benefits in Kenya: An Atlas of Ecosystems and Human Well-Being.Original data are downloadable at www.africover.org.
-
Climate Vulnerable Forum Mapping of Opportunities
This data maps opportunities for Climate Vulnerable Forum countries to enhance their Nationally Determined Contribution by 2020.
-
Wetlands in Kenya
This data was used in selected maps in Nature's Benefits in Kenya: An Atlas of Ecosystems and Human Well-Being. Original data are downloadable at www.africover.org.
-
Urban areas in Kenya
This data was used in Map 1.3 and in other maps throughout Nature's Benefits in Kenya: An Atlas of Ecosystems and Human Well-Being. Original data are downloadable at www.africover.org.
-
Locations of sand beaches in Kenya
This data was used in Map 6.4 and Map 6.5 in Nature's Benefits in Kenya: An Atlas of Ecosystems and Human Well-Being. Original data are downloadable at www.africover.org.
-
Savannah and grassland in Kenya
This data was used in Map 1.3 in Nature's Benefits in Kenya: An Atlas of Ecosystems and Human Well-Being. Original data are downloadable at www.africover.org.
-
Forest Types in Kenya, 2000
This data was used in Map 1.3 and Map 7.1 in Nature's Benefits in Kenya: An Atlas of Ecosystems and Human Well-Being. Original data are downloadable at www.africover.org.
-
Floodplains and valley bottoms in Kenya
This data was used in Map 3.14 and Map 3.15 in Nature's Benefits in Kenya: An Atlas of Ecosystems and Human Well-Being. Original data are downloadable at www.africover.org.
-
Bare areas (areas naturally devoid of vegetation) in Kenya
This data was used in Map 1.3 in Nature's Benefits in Kenya: An Atlas of Ecosystems and Human Well-Being. Original data are downloadable at www.africover.org.
-
Waterbodies in Kenya
This data was used in maps throughout Nature's Benefits in Kenya: An Atlas of Ecosystems and Human Well-Being. Original data are downloadable at www.africover.org.
-
Tree Plantations in Kenya
This data was used in Map 7.3 in Nature's Benefits in Kenya: An Atlas of Ecosystems and Human Well-Being.
-
Pineapple Plantations in Kenya
This data was used in Map 3.9 in Nature's Benefits in Kenya: An Atlas of Ecosystems and Human Well-Being. Original data are downloadable at www.africover.org.
-
Agricultural Areas in Kenya
This data was used in Map 1.3 in Nature's Benefits in Africa: An Atlas of Ecosystems and Human Well-Being. Original data are downloadable at www.africover.org.
-
Uganda Rural Poverty Data 2005
The poverty indicators produced by the Uganda Bureau of Statistics (UBOS) are based on household consumption expenditures, including both food and a range of nonfood items such as education, transport, health, and rent. Households are defined as poor when their total expenditures fall below...
-
Annual Growth of Biomass and Theoretically Harvestable Biomass Yield outside ...
This data was used in Map 7.6 and Map 7.7 in Nature's Benefits in Kenya: An Atlas of Ecosystems and Human Well-Being. Values of zero for both fields pertain to croplands and urban areas, and should be displayed as ""not applicable."" Note: All areas classified as 'natural and semi-natural' in...
