-
Local Government Renewables Action Tracker
The Tracker contains information on two types of renewables activities commonly being pursued by local governments in the United States: 1. Electricity purchases and transactions, such as on-site solar, community solar projects, off-site power purchase agreements (PPAs), and green tariff...
-
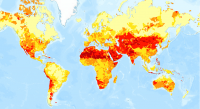
Aqueduct Global Maps 2.0
Companies can use this information to prioritize actions, investors to leverage financial interest to improve water management, and governments to engage with the private sector to seek solutions for more equitable and sustainable water governance. Aqueduct Global Maps 2.0 includes indicators of...
-
Featured Rights to Resources
The data included in this spreadsheet were downloaded from the World Resource Institute's Rights to Resources interactive map. The Rights to Resources interactive map presents the results of a legal review of national laws in sub-Saharan Africa in their treatment of local-use rights to natural...
-
Uganda Wetland Area Per Capita
The dataset results from WRI's calculation based on: 1. NATIONAL FOREST AUTHORITY (NFA). 1996. Land Cover GIS Database. Kampala, Uganda: Government of Uganda, NFA. 2. UGANDA BUREAU OF STATISTICS (UBOS). 2002b. 2002 Uganda Population and Housing Census GIS Database. Kampala, Uganda:...
-
Dataset of U.S. School Bus Fleets
This dataset contains detailed information on the composition of school bus fleets in the United States. It dataset contains data from 46 states and the District of Columbia, though the specific data available vary by state. For most states, the dataset includes bus-level information, such as the...
-
Uganda Environmental Health Census
Data used in maps 7, 8, 9, 10, 11, 12, 13 of "Mapping a Healthier Future: How Spatial Analysis Can Guide Pro-Poor Water and Sanitation Planning in Uganda." from Health Planning Department, Ministry of Health, Uganda; Directorate of Water Development, Ministry of Water and Environment, Uganda;...
-
Featured Aqueduct Global Maps 2.1 Data
Awareness around the physical, regulatory, and reputational water risks to companies and their investors is on the rise and robust, comparable and comprehensive data is needed to help assess these water-related risks. In response to this demand, the World Resources Institute developed the...
-
Fast-Start Finance Contributions
This workbook contains data from a detailed review of the 2010-2012 fast-start finance (FSF) contributions of five countries reporting the largest FSF contributions (Germany, Japan, Norway, the UK, and the USA) and from a supplemental review of the remaining FSF contributions from 31 additional...
-
Uganda Protected Areas as of 2007
Gazetted areas of Uganda as of 2007.
-
Waterbodies in Uganda
This dataset results from the combination of three datasets: 1. NATIONAL FOREST AUTHORITY (NFA). 1996. Land Cover GIS Database. Kampala, Uganda: Government of Uganda, NFA. 2. NATIONAL IMAGERY AND MAPPING AGENCY (NIMA). 1997. Vector Map Level 0 (Digital Chart of the World), 3rd Edition....
-
Subcounty administrative boundaries in Uganda in 2002
Contact Uganda Bureau of Statistics for an updated version of subcounty boundaries (Data collection from July 1999-March 2002)
-
Uganda District Boundaries 2006
Contact Uganda Bureau of Statistics for an updated version of district boundaries Note that data collection took place from July 1999 to March 2002. The data were updated in 2006.
-
Uganda Wetlands Extent and Types 1996
Data used in map 2 of "Mapping a Better Future: How Spatial Analysis Can Benefit Wetlands and Reduce Poverty in Uganda." from Wetlands Management Department, Ministry of Water and Environment, Uganda; Uganda Bureau of Statistics; International Livestock Research Institute; and World Resources...
-
Annual Projected Water Balance by Subdrainage Area in Kenya, 2000 and 2010
Calculations done by the World Resources Institute. This data was used in Map 3.7 in Nature's Benefits in Kenya: An Atlas of Ecosystems and Human Well-Being.
-
Milk Production Per Square Kilometer in Kenya, 1997
This data was used in Map 4.5 in Nature's Benefits in Kenya: An Atlas of Ecosystems and Human Well-Being.
-
Theoretical Revenue from Papyrus Harvest
The dataset results from WRI's calculation based on 1. NATIONAL FOREST AUTHORITY (NFA). 1996. Land Cover GIS Database. Kampala, Uganda: Government of Uganda. 2. KARANJA, F., L. EMERTON, J. MAFUMBO, AND W. KAKURU. 2001. Assessment of the Economic Value of Pallisa District Wetlands. Kampala,...
-
Uganda Rural Poverty Data 2005
The poverty indicators produced by the Uganda Bureau of Statistics (UBOS) are based on household consumption expenditures, including both food and a range of nonfood items such as education, transport, health, and rent. Households are defined as poor when their total expenditures fall below...
-
Milk Surplus and Deficit in Central and Western Kenya in 1997
Calculations of milk production were done by assessing the number of dairy cattle in an administrative area, and extrapolating out liters of milk per area. Demand for milk was calculated by estimating the milk needs per person, and applying that number to the population density of each area....
-
Supplementary Materials for "State of the Nationally Determined Contributions...
This dataset presents information on the adaptation components of 86 countries’ NDCs submitted until June 30, 2021, in association with the working paper State of the Nationally Determined Contributions: Enhancing Adaptation Ambition. Nine NAPs submitted by the 86 countries during this time frame...
-
Reefs at Risk Revisited (Social Vulnerability Data)
This shapefile features the Exclusive Economic Zones (EEZs) for 108 coral reef countries and territories classified according to an index of their reef dependence, adaptive capacity, and social vulnerability. Results are presented as quartiles, with 27 countries/territories classified in each of...
