-
Uganda Safe Water Coverage
Rural safe water coverage as defined by the Directorate of Water Development, Ministry of Water and Environment, Uganda. Data used in maps 3, 4, 5, 6 of ""Mapping a Healthier Future: How Spatial Analysis Can Guide Pro-Poor Water and Sanitation Planning in Uganda."" from Health Planning...
-
Water supplies serving Mombasa, Kenya
Locations of dam were approximately located by WRI based on SoK 1971, and MoWD and JICA 1992a, 1992b, 1992c. This data was used in Map 3.10 in Nature's Benefits in Kenya: An Atlas of Ecosystems and Human Well-Being.
-
Distance to water points in northern Kenya
This data was used in Map 5.8 and Map 5.9 in Nature's Benefits in Kenya: An Atlas of Ecosystems and Human Well-Being. Use attribute field VALUE to display data. Units are in kilometers. 0 = 0 kilometers from nearest water point 5 = 0.1 - 5 kilometers from nearest water point 10 = 5 -...
-
Locations of water supplies serving Nairobi, Kenya.
Locations of dam were approximately located by WRI based on SoK 1971, MoWD and JICA 1992a, 1992b, 1992c, Nyaoro 1999, and Wambua 2003. This data was used in Map 3.9 in Nature's Benefits in Kenya: An Atlas of Ecosystems and Human Well-Being.
-
Annual Projected Water Balance by Subdrainage Area in Kenya, 2000 and 2010
Calculations done by the World Resources Institute. This data was used in Map 3.7 in Nature's Benefits in Kenya: An Atlas of Ecosystems and Human Well-Being.
-
Average water consumption of livestock and wildlife by sub-basin in Kenya, 19...
WRI/ILRI calculation based on animal data from DRSRS 2003; Grunblatt et al. 1995, 1996; and daily water requirements for selected species from MoWD and JICA 1992, Peden at al. 2003, 2004. This data was used in Map 3.13 in Nature's Benefits in Kenya: An Atlas of Ecosystems and Human Well-Being.
-
WRI Ross Center for Sustainable Cities’ Water and Sanitation 15-City Study
To address the absence of comparable city-level water data, this dataset compiles data from 15 global South cities located in sub-Saharan Africa, South Asia, and Latin America and among the regions that are the focus of the World Resources Report (WRR) "Towards a More Equal City". The 15 cities...
-
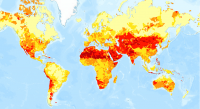
Featured Aqueduct Global Maps 2.1 Data
Awareness around the physical, regulatory, and reputational water risks to companies and their investors is on the rise and robust, comparable and comprehensive data is needed to help assess these water-related risks. In response to this demand, the World Resources Institute developed the...
-
Aqueduct Global Maps 2.0
Companies can use this information to prioritize actions, investors to leverage financial interest to improve water management, and governments to engage with the private sector to seek solutions for more equitable and sustainable water governance. Aqueduct Global Maps 2.0 includes indicators of...
-
Locations of large hydropower dams in Kenya
Locations of hydropower sites were approximately located by WRI based on SoK 1971, KenGen 2006, and from MoWD and JICA 1992a, 1992b, 1992c. This data was used in Map 3.11 in Nature's Benefits in Kenya: An Atlas of Ecosystems and Human Well-Being.
-
NWIS 1997 Data (Uganda)
Some data were used in maps 4, 5, 6, 7, 8, 9, 10 of ""Mapping a Better Future: How Spatial Analysis Can Benefit Wetlands and Reduce Poverty in Uganda."" from Wetlands Management Department, Ministry of Water and Environment, Uganda; Uganda Bureau of Statistics; International Livestock Research...
-
Proposed large-scale irrigation schemes in Kenya
This data was used in Map 3.12 in Nature's Benefits in Kenya: An Atlas of Ecosystems and Human Well-Being.
-
Uganda Environmental Health Census
Data used in maps 7, 8, 9, 10, 11, 12, 13 of "Mapping a Healthier Future: How Spatial Analysis Can Guide Pro-Poor Water and Sanitation Planning in Uganda." from Health Planning Department, Ministry of Health, Uganda; Directorate of Water Development, Ministry of Water and Environment, Uganda;...
-
Basins and sub-basins in Kenya
Calculations done by the World Resources Institute. This data was used in selected maps in Nature's Benefits in Kenya: An Atlas of Ecosystems and Human Well-Being.
-
Waterbodies in Uganda
This dataset results from the combination of three datasets: 1. NATIONAL FOREST AUTHORITY (NFA). 1996. Land Cover GIS Database. Kampala, Uganda: Government of Uganda, NFA. 2. NATIONAL IMAGERY AND MAPPING AGENCY (NIMA). 1997. Vector Map Level 0 (Digital Chart of the World), 3rd Edition....
-
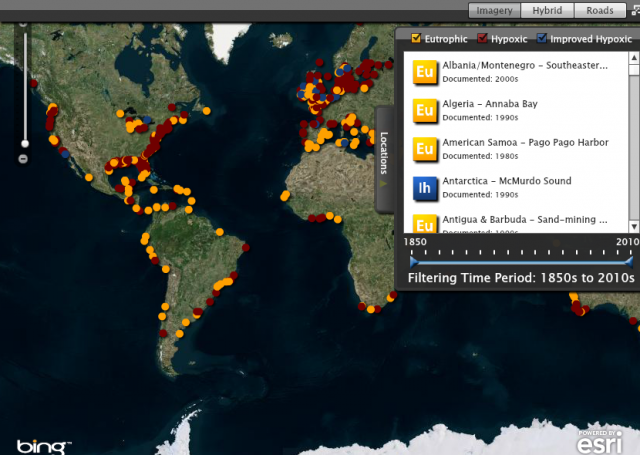
Eutrophication & Hypoxia Map Data Set
The Interactive Map of Eutrophication & Hypoxia represents 762 coastal areas impacted by eutrophication and/or hypoxia. There are 479 sites identified as experiencing hypoxia, 55 sites that once experienced hypoxia but are now improving, and 228 sites that experience other symptoms of...
-
Featured Rights to Resources
The data included in this spreadsheet were downloaded from the World Resource Institute's Rights to Resources interactive map. The Rights to Resources interactive map presents the results of a legal review of national laws in sub-Saharan Africa in their treatment of local-use rights to natural...
-
Aqueduct Global Flood Risk Country Rankings
Key Findings Approximately, 21 million people worldwide could be affected by river floods on average each year, and the 15 countries with the most people exposed, including India, Bangladesh, China, Vietnam, Pakistan, Indonesia, Egypt, Myanmar, Afghanistan, Nigeria, Brazil, Thailand, Democratic...
-
Bleaching observations (1963-2010)
This dataset was used as base data in Reefs at Risk. Point locations of reported observations of coral bleaching between 1963 and 2010. This dataset was built upon an original bleaching database developed at UNEP-WCMC, and has been maintained and updated regularly by ReefBase since early 2002.
-
Existing small-scale irrigation and drainage points in Kenya
Data compiled by the International Water Management Institute (IWMI), Nairobi, Kenya. This data was used in Map 3.12 in Nature's Benefits in Kenya: An Atlas of Ecosystems and Human Well-Being.
