-
Uganda Safe Water Coverage
Rural safe water coverage as defined by the Directorate of Water Development, Ministry of Water and Environment, Uganda. Data used in maps 3, 4, 5, 6 of ""Mapping a Healthier Future: How Spatial Analysis Can Guide Pro-Poor Water and Sanitation Planning in Uganda."" from Health Planning...
-
Featured Aqueduct Global Maps 2.1 Data
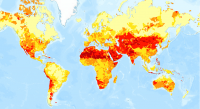
Awareness around the physical, regulatory, and reputational water risks to companies and their investors is on the rise and robust, comparable and comprehensive data is needed to help assess these water-related risks. In response to this demand, the World Resources Institute developed the...
-
Aqueduct Global Maps 2.0
Companies can use this information to prioritize actions, investors to leverage financial interest to improve water management, and governments to engage with the private sector to seek solutions for more equitable and sustainable water governance. Aqueduct Global Maps 2.0 includes indicators of...
-
Waterbodies in Uganda
This dataset results from the combination of three datasets: 1. NATIONAL FOREST AUTHORITY (NFA). 1996. Land Cover GIS Database. Kampala, Uganda: Government of Uganda, NFA. 2. NATIONAL IMAGERY AND MAPPING AGENCY (NIMA). 1997. Vector Map Level 0 (Digital Chart of the World), 3rd Edition....
-
Eutrophication & Hypoxia Map Data Set
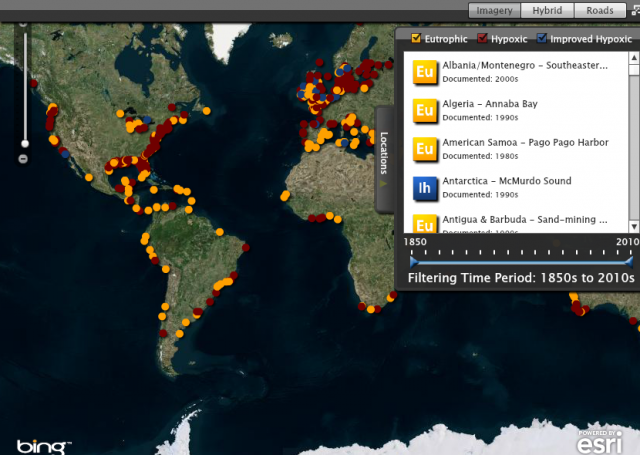
The Interactive Map of Eutrophication & Hypoxia represents 762 coastal areas impacted by eutrophication and/or hypoxia. There are 479 sites identified as experiencing hypoxia, 55 sites that once experienced hypoxia but are now improving, and 228 sites that experience other symptoms of...
-
Aqueduct Global Flood Risk Country Rankings
Key Findings Approximately, 21 million people worldwide could be affected by river floods on average each year, and the 15 countries with the most people exposed, including India, Bangladesh, China, Vietnam, Pakistan, Indonesia, Egypt, Myanmar, Afghanistan, Nigeria, Brazil, Thailand, Democratic...
