-
Uganda District Boundaries 2006
Contact Uganda Bureau of Statistics for an updated version of district boundaries Note that data collection took place from July 1999 to March 2002. The data were updated in 2006.
-
Theoretical Revenue from Papyrus Harvest
The dataset results from WRI's calculation based on 1. NATIONAL FOREST AUTHORITY (NFA). 1996. Land Cover GIS Database. Kampala, Uganda: Government of Uganda. 2. KARANJA, F., L. EMERTON, J. MAFUMBO, AND W. KAKURU. 2001. Assessment of the Economic Value of Pallisa District Wetlands. Kampala,...
-
NWIS 1997 Data (Uganda)
Some data were used in maps 4, 5, 6, 7, 8, 9, 10 of ""Mapping a Better Future: How Spatial Analysis Can Benefit Wetlands and Reduce Poverty in Uganda."" from Wetlands Management Department, Ministry of Water and Environment, Uganda; Uganda Bureau of Statistics; International Livestock Research...
-
Uganda Wetlands Extent and Types 1996
Data used in map 2 of "Mapping a Better Future: How Spatial Analysis Can Benefit Wetlands and Reduce Poverty in Uganda." from Wetlands Management Department, Ministry of Water and Environment, Uganda; Uganda Bureau of Statistics; International Livestock Research Institute; and World Resources...
-
Uganda Wetland Area Per Capita
The dataset results from WRI's calculation based on: 1. NATIONAL FOREST AUTHORITY (NFA). 1996. Land Cover GIS Database. Kampala, Uganda: Government of Uganda, NFA. 2. UGANDA BUREAU OF STATISTICS (UBOS). 2002b. 2002 Uganda Population and Housing Census GIS Database. Kampala, Uganda:...
-
Uganda Rural Poverty Data 2005
The poverty indicators produced by the Uganda Bureau of Statistics (UBOS) are based on household consumption expenditures, including both food and a range of nonfood items such as education, transport, health, and rent. Households are defined as poor when their total expenditures fall below...
-
CAIT - Countries' Pre-2020 Climate Pledges submitted to the UNFCCC
The structured data from the CAIT Pre-2020 Pledges Map enables users to explore, compare, and assess climate change mitigation pledges submitted by Parties to the United Nations Framework Convention on Climate Change (UNFCCC) in 2009 and 2010. The information related to quantified economy-wide...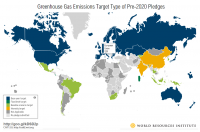
-
CAIT - Country Clean Technology Data
This collection emerges from a collaboration of five leading research institutions: World Resources Institute (WRI), Institute for Global Environmental Strategies (IGES), Öko Institut, Renmin University, and The Energy and Resources Institute (TERI), based in the target countries. Researchers at...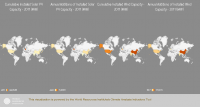
-
CAIT Indonesia Climate Data Explorer (PINDAI) Data
The data set draws primarily from Local Action Plan for Greenhouse Gas Emission Reduction (RAD GRK), and Medium Term Local Development Plans (RPJMD) of each province in Indonesia. These documents are obtained from Indonesian national and regional government agencies, including the Secretariat of...
-
Featured Aqueduct Global Maps 2.1 Data
Awareness around the physical, regulatory, and reputational water risks to companies and their investors is on the rise and robust, comparable and comprehensive data is needed to help assess these water-related risks. In response to this demand, the World Resources Institute developed the...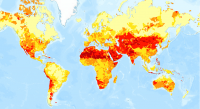
-
Aqueduct Global Maps 2.0
Companies can use this information to prioritize actions, investors to leverage financial interest to improve water management, and governments to engage with the private sector to seek solutions for more equitable and sustainable water governance. Aqueduct Global Maps 2.0 includes indicators of...
-
Fast-Start Finance Contributions
This workbook contains data from a detailed review of the 2010-2012 fast-start finance (FSF) contributions of five countries reporting the largest FSF contributions (Germany, Japan, Norway, the UK, and the USA) and from a supplemental review of the remaining FSF contributions from 31 additional...
-
Eutrophication & Hypoxia Map Data Set
The Interactive Map of Eutrophication & Hypoxia represents 762 coastal areas impacted by eutrophication and/or hypoxia. There are 479 sites identified as experiencing hypoxia, 55 sites that once experienced hypoxia but are now improving, and 228 sites that experience other symptoms of...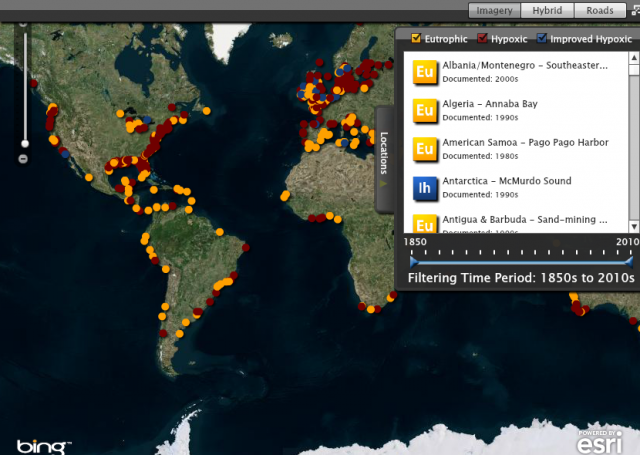
-
Featured Aqueduct Global Flood Risk Maps
For the current scenario, we used hydrological data from 1960 through 1999 for generating flood inundations for 9 return periods, from 2-year flood to 1000-year flood, and 2010 GDP, population, and land use data for assessing flood impacts. For future projections, we used 5 GCMs (Global Climate...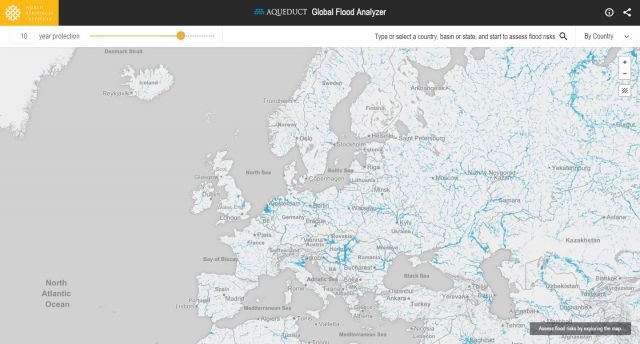
-
Aqueduct Global Flood Risk Country Rankings
Key Findings Approximately, 21 million people worldwide could be affected by river floods on average each year, and the 15 countries with the most people exposed, including India, Bangladesh, China, Vietnam, Pakistan, Indonesia, Egypt, Myanmar, Afghanistan, Nigeria, Brazil, Thailand, Democratic...
